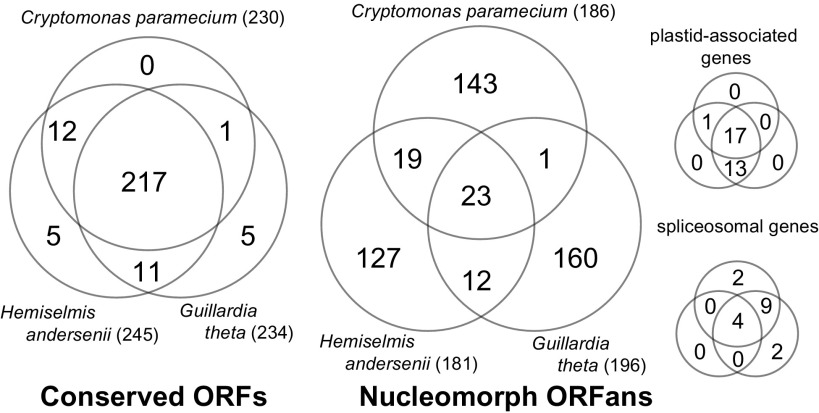
FIG. 2.—
Gene content comparison of three cryptomonad nucleomorph genomes. The Venn diagrams show the number of shared and/or unique genes in four categories: conserved ORFs (left), nucleomorph ORFans (middle), plastid-associated genes (right top), and spliceosomal genes (right bottom). The numbers beside species names are the total gene numbers under consideration.

