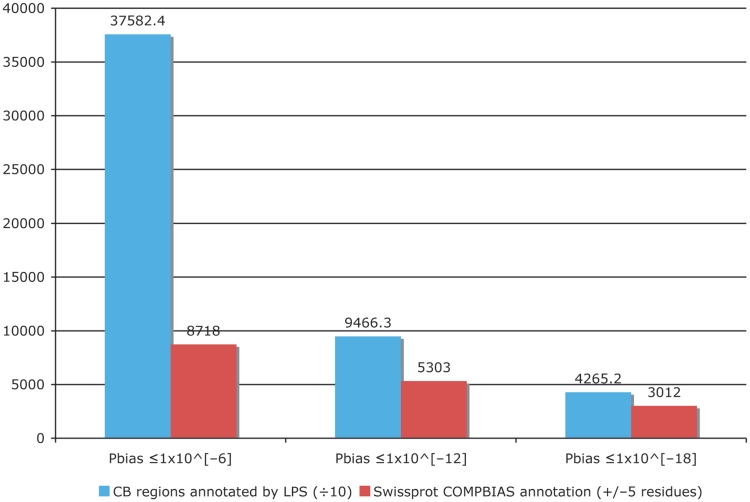
Figure 4.
Column chart showing the augmentation of existing COMPBIAS annotations in UniProt, using the LPS algorithm. The blue column shows the number of CB regions annotated with the LPS-annotate algorithm, for three different P-value thresholds (10−6; 10−12; 10−18). The red columns are the existing UniProt COMPBIAS records that overlap the new LPS-annotate annotations (±5 residues at either end of the regions). The UniProt COMPBIAS records are intentionally limited in the UniProt/SwissProt databases to a few, more specific cases, such as homopolymeric runs, with up to one or two short interruptions in the run (26).

