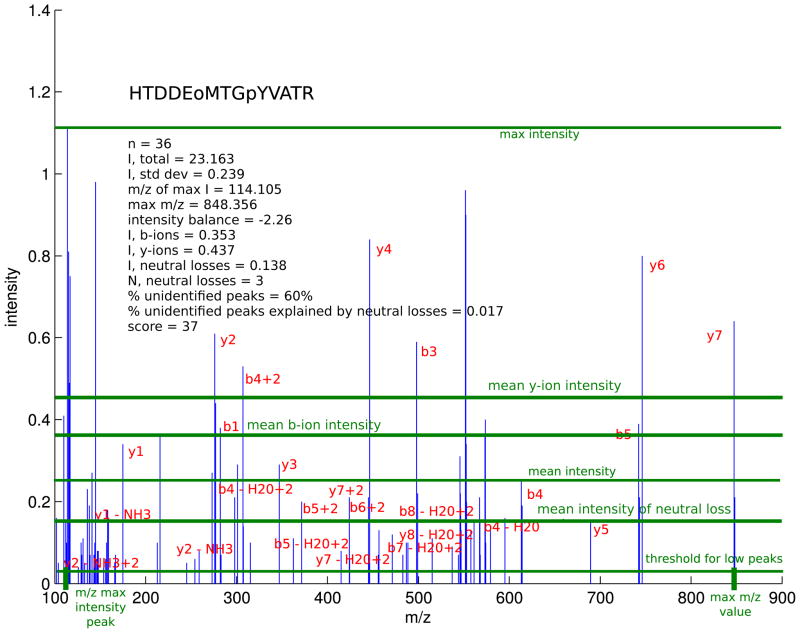
Figure 2.
MS/MS spectrum assigned to the tyrosine phosphorylated peptide from the activation loop of the p38 mitogen-activated protein kinase. Peak assignments are highlighted in red, and features extracted from the spectrum are shown in green. Phosphorylated residues are preceded by lower-case “p”, and oxidation of methionine to the sulfoxide is indicated by lower-case “o”.

