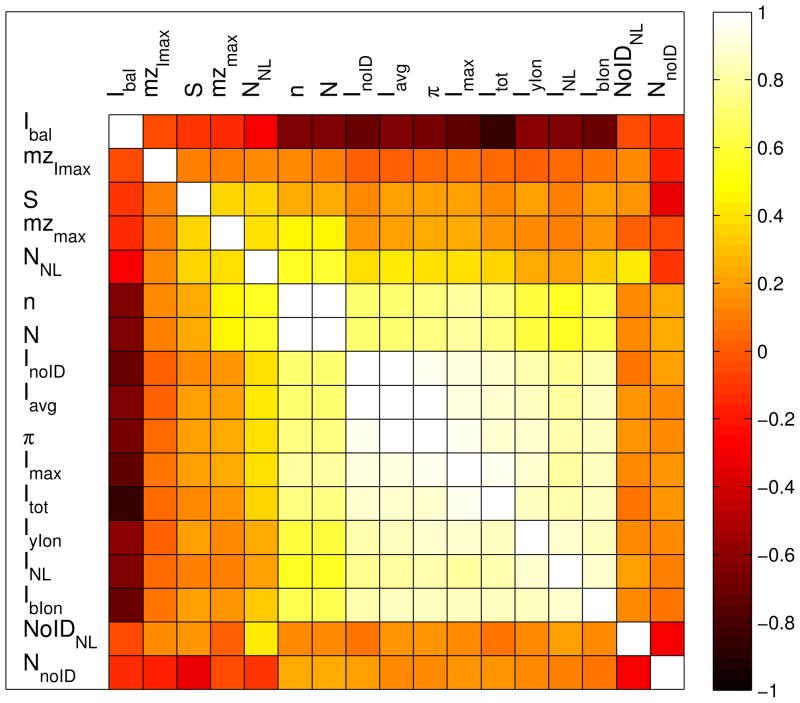
Figure 3.
Correlation of all 17 features extracted from phospho-MS/MS spectra. The features are grouped based on clustering of their correlations. The colors correspond to correlation values: Light and yellow denote strong positive correlation whereas black and dark colors correspond to strong negative correlation, and orange/red coloring weak correlation. The features N (number of peaks), Imax (maximum intensity), Iavg (mean intensity) and InoID (mean intensity of unidentified peaks) were removed from further analysis due to high correlation (>95%).

