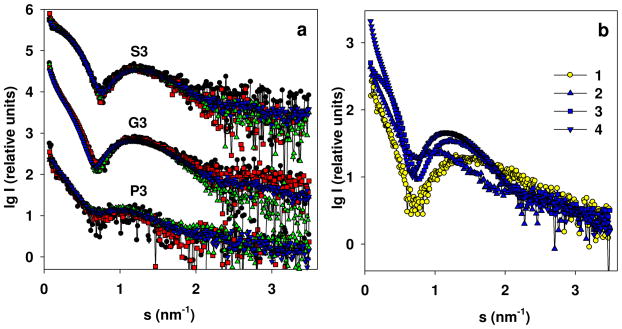
Figure 2.
(a) Experimental SAXS profiles from the copolymers in solution for the samples P3, G3, and S3: P3 with the solution concentrations of 1.0 (black circles), 2.0 (red squares), 4.0 (green triangles up), and 7.84 (blue triangles down); G3 with the solution concentrations of 1.0 (black circles), 2.0 (red squares), 4.0 (green triangles up), and 7.4 mg/mL (blue triangles down); S3 with the solution concentrations of 1.0 (black circles), 2.0 (red squares), 4.0 (green triangles up), and 6.4 mg/mL (blue triangles down). The patterns belonging to different copolymers are appropriately displaced along the logarithmic axis for better visualization. (b) A comparison of scattering profiles at the highest concentration for PMAcOD (1), P3 (2), G3 (3), and S3 (4).

