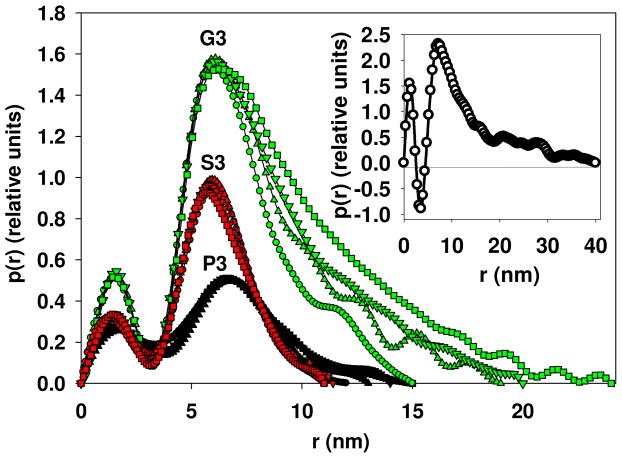
Figure 3.
Distance distribution functions for the P3, S3, and G3 samples at different concentrations: P3 with the solution concentrations of 1.0 (circles), 2.0 (triangle up), 4.0 (triangle down), and 7.84 mg/mL (square); S3 with the solution concentrations of 1.0 (circles), 2.0 (triangle up), 4.0 (triangle down), and 6.4 mg/mL (square); G3 with the solution concentrations of 1.0 (circles), 2.0 (triangle up), 4.0 (triangle down), and 7.4 mg/mL (square). In the inset: the distance distribution function for the PMAcOD copolymer in solution.41

