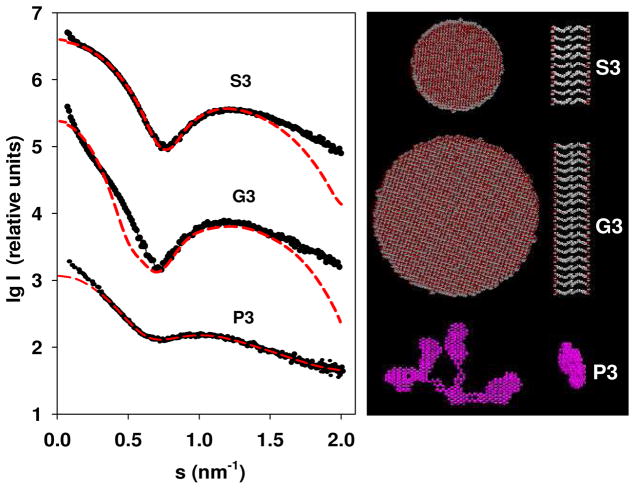
Figure 5.
Modeling and the best fits: the experimental scattering curve from the modified PMAcOD copolymer in solution (black circles) and the best fits to the experimental profile of the scattering patterns computed from models (red dotted lines). Modelling was performed at maximal concentrations to reduce the influence of the experimental noise. The right panel: disk like models for the S3 and G3 samples in two orientations, and a dummy atom model for the P3 specimen. Separately, a structure of the dense formations in the body of the P3 micelles is shown

