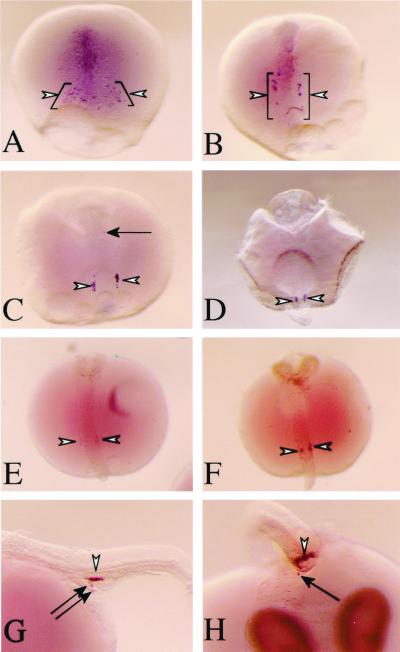
Figure 5.
Detection of endogenous olvas (A–D, G, and H) and GFP (E and F) transcripts by whole-mount in situ hybridization (white arrowheads). (A) Stage 16, olvas-expressing cells decrease in number and converge on the embryonic shield. Stages 18 (B) and 21 (C), olvas-expressing cells align bilaterally along the trunk. (D) Stage 27, two clumps form at the ventrolateral region of the intestine. Stages 21 (E) and 27 (F) are also shown. Black arrows in C, G (stage 32, lateral view), and H (stage 32, a view from the tail) indicate cells expressing endogenous olvas transcripts in ectopic locations.

