Figure 2.
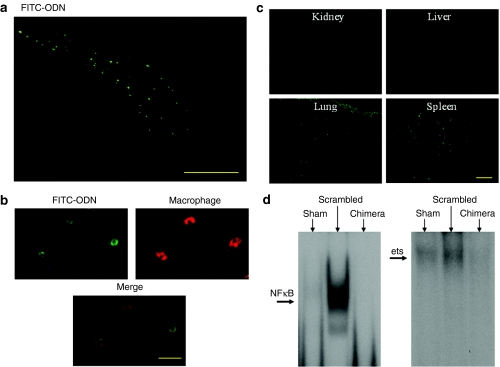
Distribution of FITC-labeled R-ODN and inhibition of binding activity of NFκB and ets. (a) Typical photograph of fluorescence in aneurysm wall of rat. Fluorescence could be detected mainly in the outer aortic wall and retroperitoneal space beside the aorta on day 7 after injection of FITC-labeled R-ODNs. (b) Immunofluoresent staining for macrophages at 1 week after intraperitoneal injection of FITC-labeled R-ODN. FITC-labeled R-ODNs were found in the migrating macrophages. (c) Distribution of FITC-labeled R-ODN in untargeted organs. Fluorescence was detected in the spleen and lung. (d) Representative results of electrophoretic mobility shift assay for NFκB and ets-binding sites at 1 week after transfection. Bar in a = 200 µm; in b = 20 µm; in c = 200 µm. chimera, AAA model transfected with chimeric R-ODN; FITC-ODN, fluorescent isothiocyanate-labeled oligodeoxynucleotide; NFκB, nuclear factor κB; scrambled, AAA model transfected with scrambled R-ODN.

