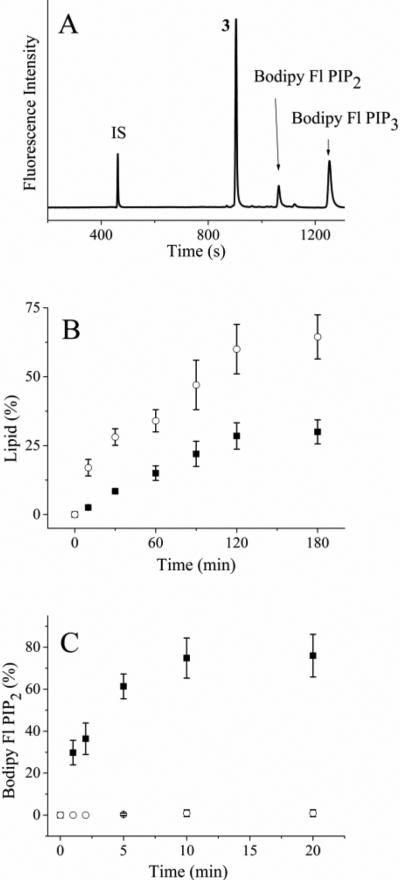
Figure 1.
Incubation of PI3K and PTEN with fluorescent lipids in vitro. (A) Electropherogram of the reaction mixture of Bodipy Fl PIP2 and PI3K after 120 min. The internal standard fluorescein is marked as “IS” while the peak co-migrating with Bodipy Fl PIP1 is marked with a “3”. (B) Time course of the reaction of Bodipy Fl PIP2 with PI3K. The solid squares represent the percentage of Bodipy Fl PIP3 while the open circles reflect the percentage of the lipid in the peak co-migrating with Bodipy Fl PIP1 (peak 3 above), respectively. (C) Time course of the reaction of Bodipy Fl PIP3 with PTEN. The solid squares and open circles are the percentage of Bodipy Fl PIP3 in the absence and presence of 500 nM bpv (pic), respectively. The data in panels B and C represent the average of three experiments and the error bars depict the standard deviation of the data points.

