
Figure 3. Kir2.1 T141 Mutant Channel Properties.
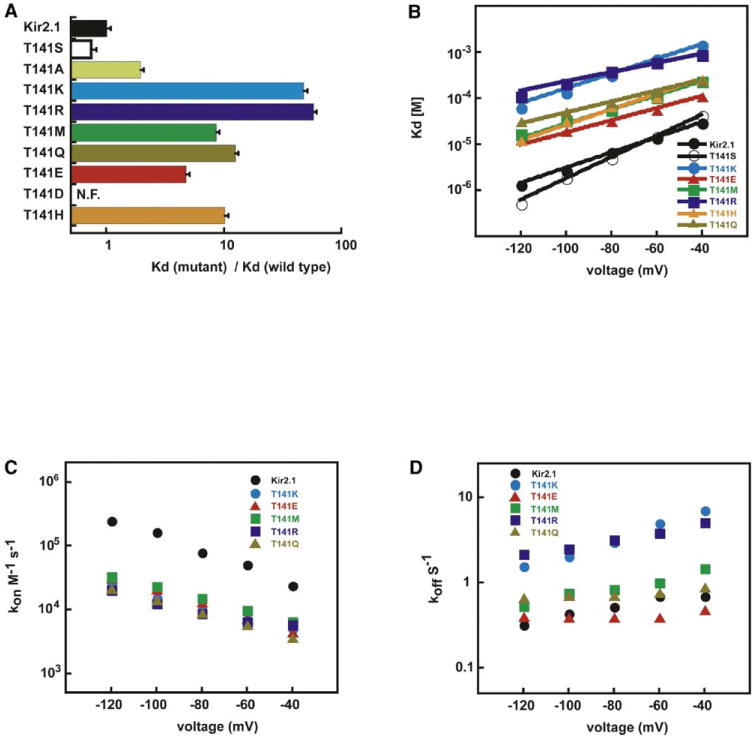
(A) Comparison of relative barium dissociation constants of T141 mutant channels relative to wild-type and D172N at −80 mV. N.F., nonfunctional. T141A data are from Alagem et al. (2001). Error bars show standard deviations.
(B) Voltage dependence of steady-state barium block. Lines show fits to the Woodhull equation (Woodhull, 1973) Kd(V) = Kd(0)exp(zFδ/RT × V), Kd(0) values (μM) are as follows: Kir2.1, 131 ± 3; T141S, 349 ± 6; T141K, 6241 ± 468; T141R, 2218 ± 176; T141E, 362 ± 26; T141Q, 715 ± 40; T141H, 1199 ± 189; T141M, 934 ± 84. δ values are as follows: Kir2.1, 0.56 ± 0.02; T141K, 0.47 ± 0.02; T141R, 0.30 ± 0.02; T141E, 0.39 ± 0.04; T141Q, 0.35 ± 0.02; T141H, 0.50 ± 0.02; and T141M, 0.46 ± 0.02.
(C) kon (M−1 s−1) and (D) koff (s−1) for Kir2.1, T141R, T141K, T141E, and T141M. Throughout the figure, channels are denoted: Kir2.1 (black), T141S (open symbols), T141A (light green), T141K (blue), T141R (dark blue), T141M (green), T141E (red), T141Q (gold), and T141H (orange).