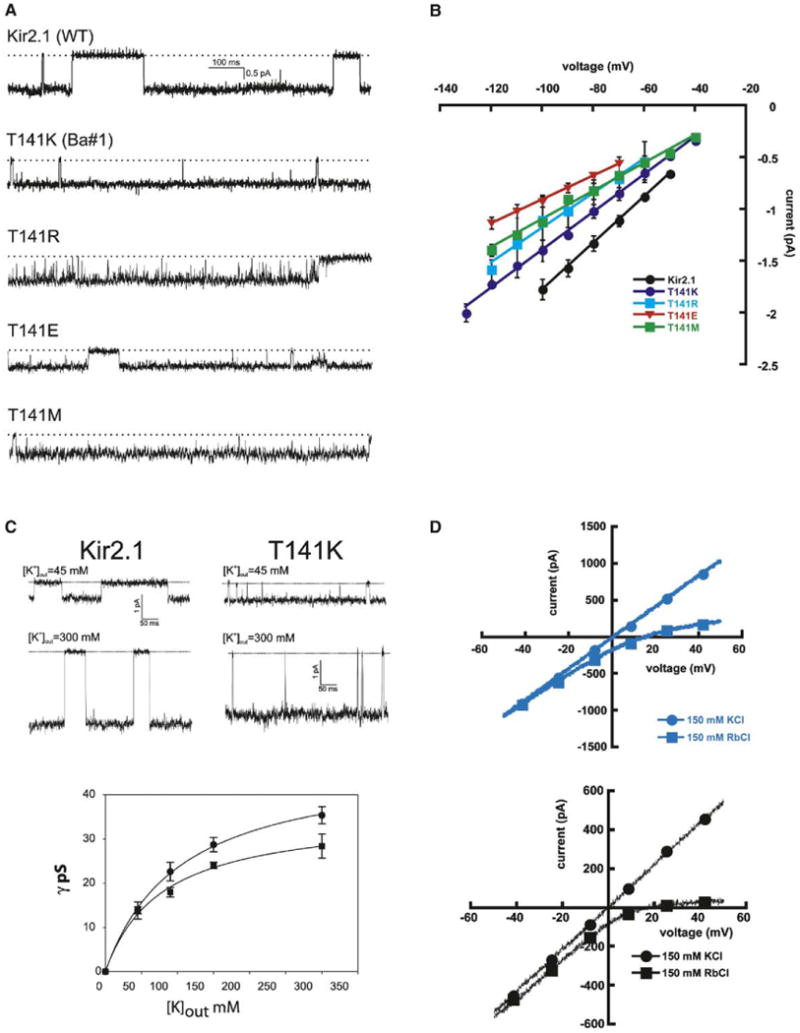
Figure 4. Comparison of Single Channel Properties of Kir2.1 and T141 Mutants.

(A) Single-channel traces for Kir2.1, T141K, T141R, T141E, and T141M at −80 mV. The dotted lines denote the closed-state current levels. The T141M patch contained two channels.
(B) I-V plots for Kir2.1 (n = 3), T141K (n = 5), T141R (n = 9), T141E (n = 10), and T141M (n = 3). The lines are linear regressions, and the error bars show the standard deviations.
(C) (Top) Cell-attached single-channel records for Kir2.1 and T141K at −80 mV in the presence of different external potassium concentrations. (Bottom) Single-channel conductance as a function of [K+] out and Michaelis-Menten fits are indicated. Error bars show standard deviations.
(D) Comparison of I-V relations from inside-out excised macropatches of T141K (blue, top) and Kir2.1 (black, bottom) under either symmetrical 150 mM KCl (●) or the bi-ionic condition of 150 mM K+ on the extracellular and 150 mM Rb+ on the intracellular sides of the membrane (■). Data are from ramp protocols. Symbols are shown to guide the reader.
