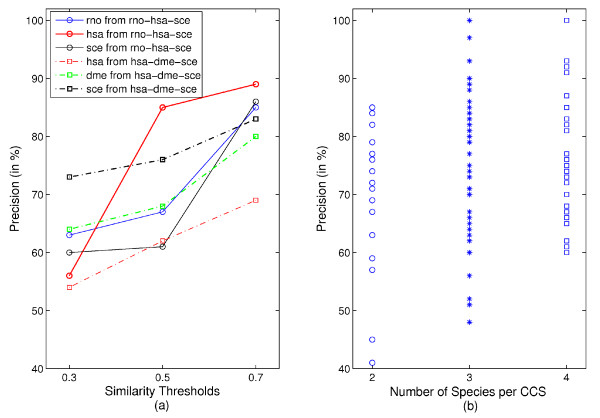
Figure 5.
Correlation of the prediction precision with (a) functional and (b) evolutionary conservation, respectively. (a) Species-specific precision values for predictions derived from CCS among rno-hsa-sce (solid lines) and hsa-dme-sce (dashed lines). For each species we plot the estimated precision against the applied similarity threshold (low: 0.3, medium: 0.5, high: 0.7) that indicates the level of functional conservation. (b) Species-specific precision grouped by evolutionary conservation that is given by the increasing number of species involved in a CCS.

