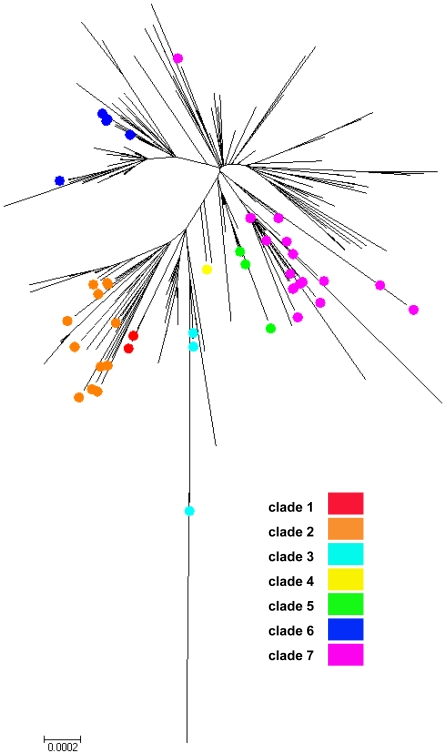
Figure 3. Phylogenetic relationships for A/H1N1pdm viruses sampled from Canada and globally.
Phylogenetic tree inferred for two hundred thirty five virus whole genomes sampled from Canada and representative global reference genomes using the Neighbour-joining (NJ) method. Scale bar indicates the number of nucleotide substitutions per site. Colour-coding: clade 1 (not shown); clade 2 (orange); clade 3 (teal); clade 4 (yellow); clade 5 (green); clade 6 (blue), and clade 7 (pink).

