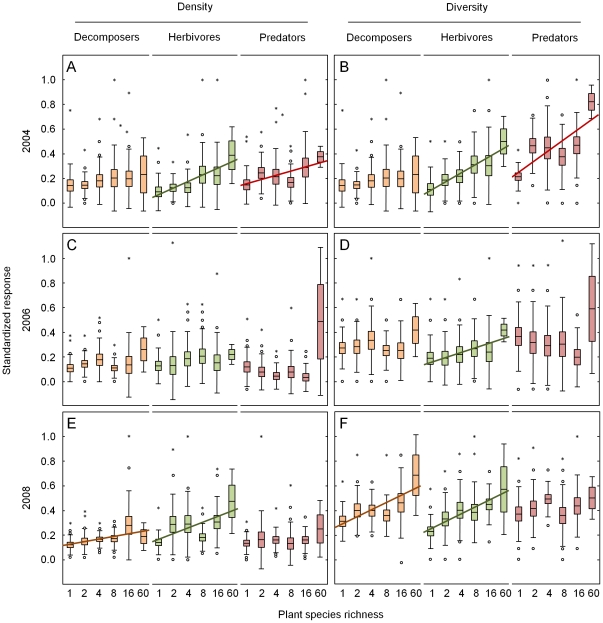
Figure 2. Plant species richness effects on soil macrofauna.
Variations in the standardized (0 to 1) density (A, C, E) and diversity (B, D, F) of decomposers, herbivores and predators as affected by plant species richness in 2004 (A, B), 2006 (C, D) and 2008 (E, F). Regression lines indicate significant effects (P<0.05) and marginally significant effects (P<0.1; dashed line); brown lines indicate decomposers in the broader sense (including microbivores), green lines indicate herbivores, and red lines indicate predators; means (lines) with standard error (boxes), standard deviation (error bars), extremes (dots) and outliers (asterisks).

