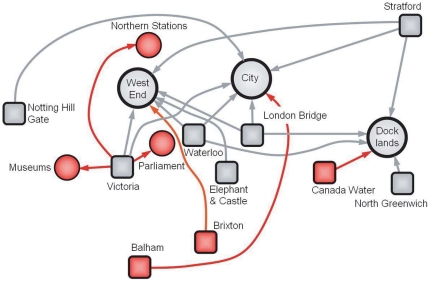
Figure 6. Structure of flows at  and
and  of the total flow.
When considering the most important flows from stations to centers such their sum represents  of the total flow in the network, we observe sources (represented as squares) with outdegree
  such as London Bridge, Stratford, or Waterloo connecting to three different centers (represented as circles), as well as sources with
  (eg. Victoria) and
  (eg. Elephant and Castle). We also show how the pattern of flows is constructed iteratively when we go to larger fraction of the total flow (from
  shown in black to
  shown in red). We represent in red the new sources, centers and connections. The new sources connect to the older centers (eg. West End, City, etc) and the existing sources (eg. Victoria) connect to new centers (eg. Northern stations, Museums, and Parliament).

