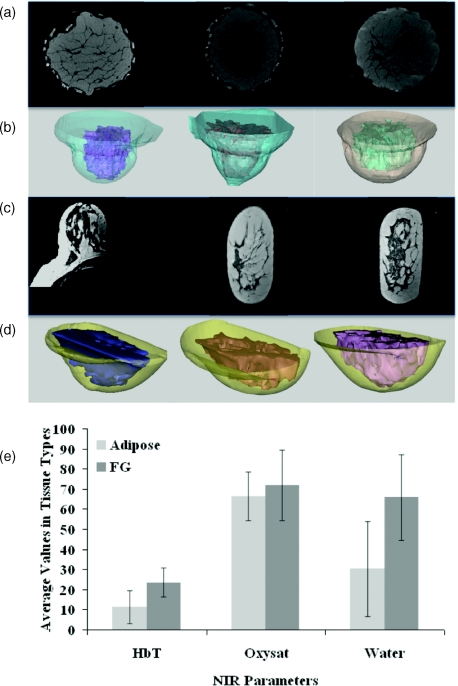
Figure 4.
(a) Representative MRI coronal slices are shown for healthy subjects 1–3 and (b) corresponding surfaces for adipose and fibroglandular (FG) tissues obtained from MR image segmentation. (c) Same as (a) for healthy subjects 4–6 imaged in the slab-geometry and (d) corresponding surfaces. Reconstructed estimates of adipose and FG are shown in (e) the bar graph with standard deviation for these six subjects.

