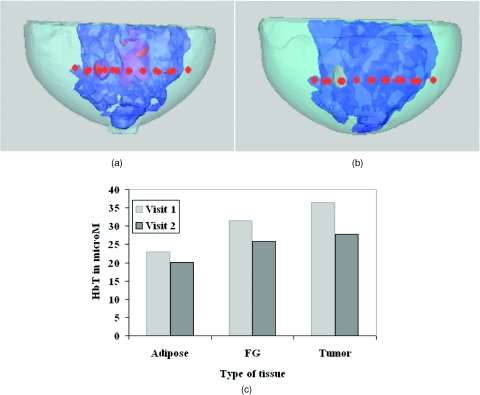
Figure 5.
Surface renderings of adipose, FG, and lesions segmented from T1-weighted MRI and DCE-MRI of subject 7 undergoing NACT are shown for (a) visit 1 corresponding to cycle 2 and (b) visit 2 corresponding to cycle 4. The red markers indicate optical fiber locations. (c) Reconstructed IG-NIRS values are displayed for HbT in adipose, FG, and tumor tissues for both visits. The subject experienced a pathologic complete response.

