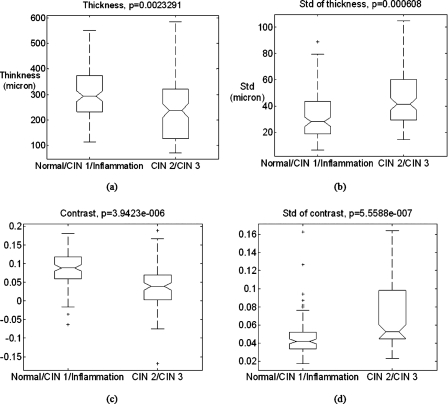
Figure 3.
Box plots of the four quantified image features. On each box, the central mark is the median, the edges of the box are the 25th and 75th percentiles, the whiskers extend to the most extreme data points not considered outliers, and the outliers are marked by the plus sign. (a) The thickness. (b) The standard deviation (Std) of thickness within an image. (c) The contrast. (d) The standard deviation of contrast within an image. The p-values are from F-tests with the null hypothesis that the means have no difference.

