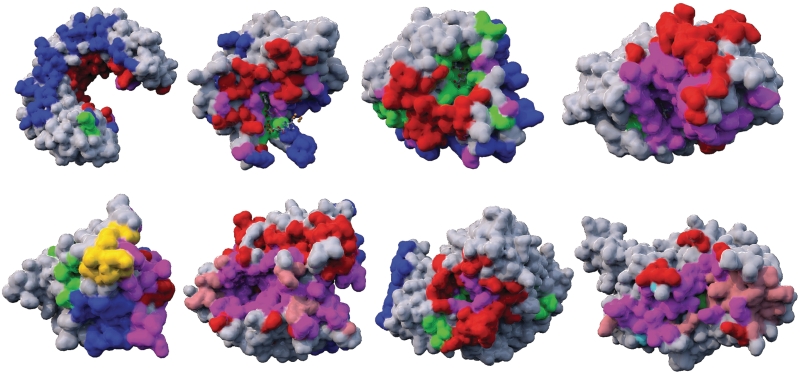
Figure 5.
Molecular Cartography of binding sites. Heterodimeric binding sites are represented in red, homodimeric and ligand binding sites in blue and green, respectively and DNA and peptide binding sites in yellow and salmon, respectively. Polyvalent binding sites are indicated in purple. From top left to bottom right, the cartography of proteins: ribonuclease inhibitor (1dfj), ferrodoxin-nadp reductase (1ewy); neuraminidase (3b7e); cAMP-dependent kinase (1ydr); p53 tumor suppressor (1tsr); neurotoxin bont/A (1xtg); acetylcholinesterase (1fss); guanine nucleotide-binding protein G(i) (1bof).

