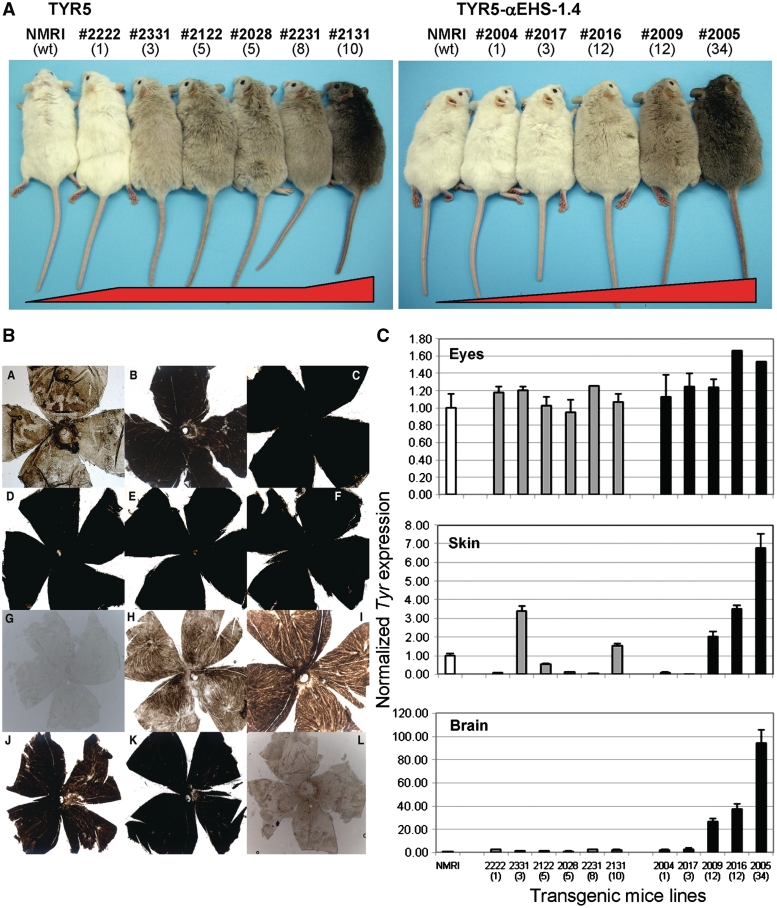
Figure 2.
Analysis of TYR5 versusTYR5–αEHS-1.4 transgenic mice. (A) Coat color of transgenic mice. Representative F1 individuals from TYR5 (left) and TYR5–αEHS-1.4 (right) transgenic mice are shown alongside non-transgenic albino NMRI littermates (wt, for wild-type), used as the recipient mouse strain for transgenesis. The number of the independent transgenic line and number of integrated transgene copies (in brackets) are shown on the top. (B) Retinas of TYR5 and TYR5–αEHS-1.4 transgenic mice. Whole-mount retinas showing pigmentation levels due to the retinal pigment epithelium and the overlaying choroid with melanocytes, from adult TYR5 (panels A to F: A, line #2222; B, line #2332; C, line #2122; D, line #2028; E, line #2231; F, line #2131) and TYR5–αEHS1.4 (panels G to K: G, line #2004; H, line #2017; I, line #2016; J, line #2009; K, line #2005) transgenic mice. A retina from a non-transgenic albino NMRI littermate is included for reference (panel L). (C) Analysis of tyrosinase gene expression. Tyrosinase (Tyr) gene expression was measured by quantitative RT–PCR using specific TaqMan and reference (Tbp) probes in all transgenic mouse lines carrying the TYR5 (grey bars) and the TYR5–αEHS-1.4 (solid black bars) construct in total RNA isolated from three different tissues: eyes (top chart), dorsal skin (middle), and whole brain (bottom). Two F1 or F2 adult representative animals from each transgenic mouse line were used for measurements. Results are shown as averages ± SD. The number of each of the transgenic mouse lines and their corresponding transgene copy-number (in brackets) is indicated below each bar. A non-transgenic albino NMRI littermate (white bar) was used as a control for all tissues.

