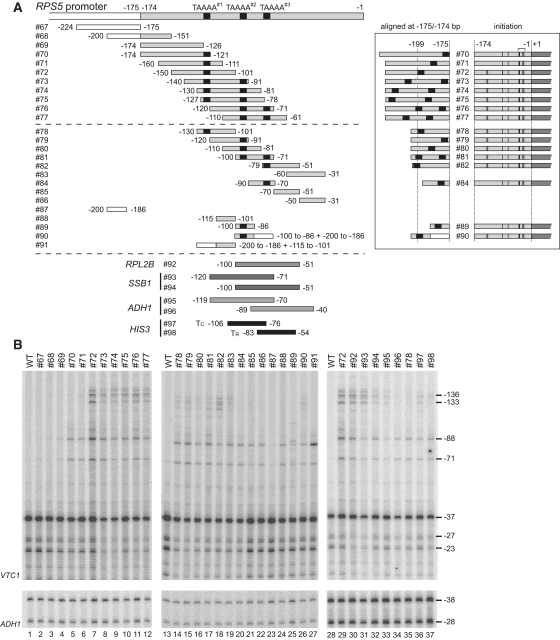
Figure 4.
CE activities of the core promoter fragments derived from RPS5 and several other genes. (A) Schematic diagram showing a series of promoter fragments from RPS5 (top and middle panels), RPL2B, SSB1, ADH1 and HIS3 (bottom panel) tested for CE activities by inserting them at −175/−174 bp of the RPS5 core promoter (as described for #60 in Figure 2B). The three ‘TAAAA’ sequences (TAAAA#1–#3) in the RPS5 promoter are marked with small black rectangles. To facilitate a comparison of the distances between ‘TAAAA’ and the −175/−174 bp insertion sites, the constructs containing these ‘TAAAA’ sequences were aligned (see inset) according to their insertion sites (i.e. −175/−174 bp). Transcriptional initiation activities from the sites at −136, −133, −88, −71, −37, −27 and −23 bp of these constructs were examined in (B) and summarized schematically as in Figure 2D (see inset). The boundaries corresponding to the 5′- or 3′-ends of each promoter fragment are indicated. The number of each construct is also indicated (left). Note that #90 and #91 are chimeric constructs between UAS (white rectangle) and core (grey rectangle). Detailed sequence information is given in Supplementary Figure 1. (B) CE activity of each insert (#67–#98 as depicted in A) to induce ectopic initiation site(s). Primer extension analysis was done as described in Figure 2B.

