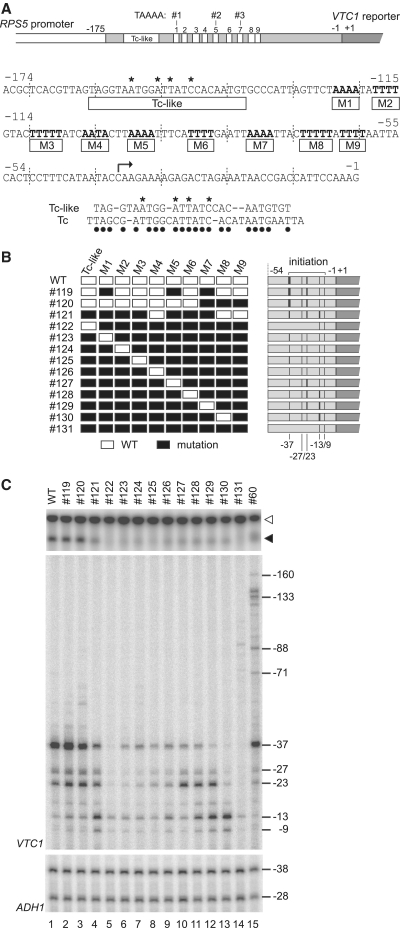
Figure 6.
Highly redundant functions of multiple AT-rich CE within the original RPS5 promoter. (A) Schematic diagram showing the sequence of the RPS5 core promoter (−174 to −1 bp) in which 10 potential CE are highlighted. The right-angled arrow indicates a major transcriptional initiation site (−37 bp) in the RPS5 promoter. Sequence comparison between the Tc-like region and the HIS3 Tc element (53) is shown below the sequence of the RPS5 core promoter. Asterisks indicate residues mutated in (B) and dots indicate identical residues in the two elements. (B) Schematic diagram showing a series of RPS5 promoter (−631 to −1 bp) constructs (#119–#131) containing different combinations of 10 intact (white rectangle) or mutated (black rectangle) potential CE. Detailed sequence information for these constructs is shown in Supplementary Figure 2. Transcriptional initiation activities from the sites at −160, −133, −88, −71, −37, −27, −23, −13 and −9 bp that were examined in (C) are summarized schematically as in Figure 2D. (C) Transcriptional activity of the RPS5 promoters constructed in (B). Northern blot analysis (top panel) to determine the expression levels of VTC1 was performed as described in Figure 1B. Primer extension analysis was performed for VTC1 (middle panel) and ADH1 (control, bottom panel) as described in Figure 2B.

