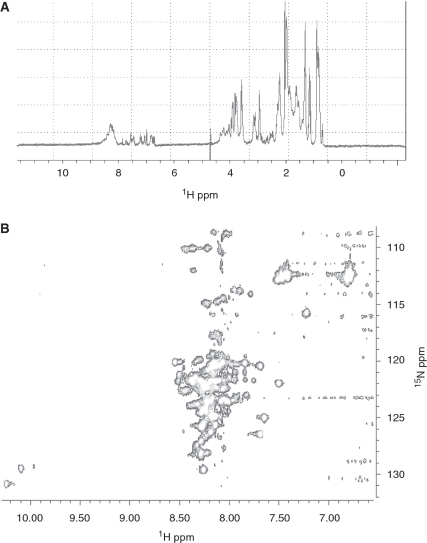
Figure 4.
NMR spectroscopy analysis of NT-SMG-912–180. (A) 1H monodimensional spectrum of NT-SMG-912–180 showing the overlapping of signals in a narrow chemical shift in a range centered at 8.25 ppm. (B) 1H-15N HSQC spectrum of 15N-labelled NT-SMG-912–180 unambiguously identified this domain as inherently unstructured due to the absence of well dispersed cross peaks. The presence of well-resolved peaks and the absence of dispersion discarded any non-specific aggregation.

