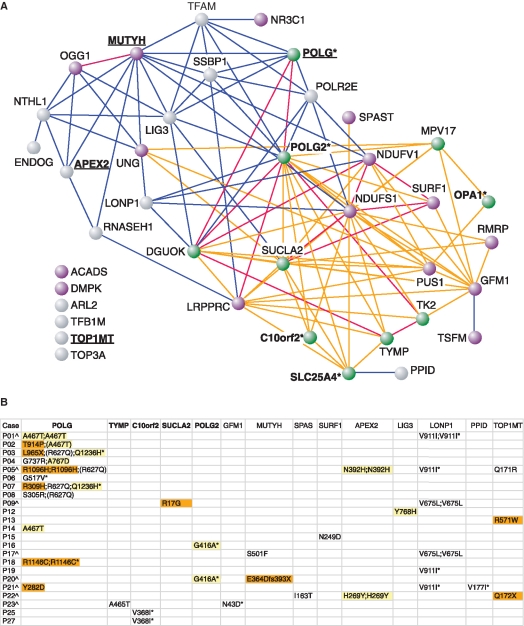
Figure 5.
Candidate gene analysis of mtDNA maintenance disorders. (A) The 39 genes include 10 genes causing mtDNA maintenance disorders (green nodes), 15 disease genes with suspected functions in mtDNA metabolism and/or similarities in their disease phenotypes (purple nodes), and 14 non-disease candidate genes with functions in mtDNA maintenance (grey nodes) (Supplementary Table S2). Gene relationships are predicted through functional interactions (likelihood ratios; LR) (20) and disease-phenotypic similarities (quantitative phenotypic associations; QPA) (21) with the edge colors: red—gene pairs with highest correlation of LR and QPA; blue—gene pairs with LR only; and orange—gene pairs with QPA only (≥0.4). The six genes at bottom left have multiple functional interactions to this network through intermediate genes (data not shown). Five disease genes (asterisk) are associated with dominant inheritance patterns and four of these genes (C10Orf2, OPA1, POLG, SLC25A4) are also causing recessive disorders (17,18). In this study we identified novel DNA variants in several cases in POLG, APEX2, MUTYH, TOP1MT (underlined). (B) The table shows amino acid changes (acronym p. not shown) identified in only the 23 cases and not controls. Five of these 14 genes (in bold) are known to cause mtDNA maintenance disorders (green nodes in A). The color codes indicate PolyPhen’s functional predictions (38) with ‘possibly damaging’ (yellow) and ‘probably damaging’ (orange), while all other amino acid changes are predicted benign (Supplementary Table S6). Positions that escaped array detection are shown in parenthesis, (asterisk) indicate dbSNP positions, and (caret symbol) are cases with rare variants in multiple genes hypothesizing a synergistic effect on the disease phenotype.

