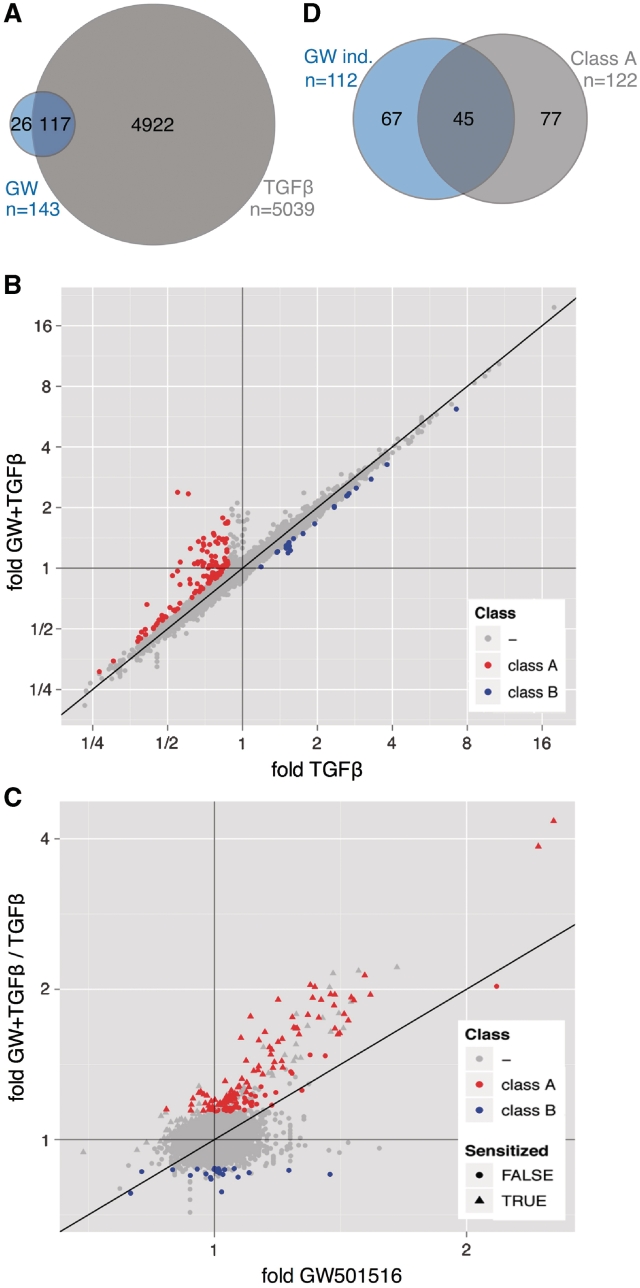
Figure 2.
Genome-wide expression profiling of WI38 cells treated with TGFβ, PPARβ/δ agonist or both ligands. (A) Venn diagram depicting the numbers of probes showing regulation by TGFβ or GW501516 (≥1.3-fold change). The overlap represents those probes that indicate regulation by both ligands. (B) Dot plot analyzing for individual probes the effect of GW501516 on TGFβ-mediated regulation. Relative expression levels measured after co-treatment of WI38 cells with TGFβ plus GW501516 were plotted against expression levels measured after treatment with TGFβ alone. Red data points represent probes indicating reversion by GW501516 of TGFβ-mediated repression (≥1.3-fold upregulation; class A genes), blue data points represent probes indicating reversion by GW501516 of TGFβ-mediated activation (≥1.3-fold difference; class B genes). (C) Dot plot showing for individual probes a TGFβ-mediated increased GW501516 inducibility. Induction by GW501516 in the presence of TGFβ was plotted against the induction by GW501516 in the absence of TGFβ. The former value was calculated as the ratio of (fold induction by both ligands) / (fold induction by TGFβ). Red data points represent the class A probes defined in panel B. Triangles indicate sensitization by TGFβ, i.e. an increased induction (≥1.3-fold) by GW501516 in the presence of TGFβ (y-value/x-value ≥1.3). (D) Venn diagram illustrating the overlap between class A genes and all genes induced by GW501516 (≥30% induction, n = 112). This analysis includes only those genes, for which the effect of TGFβ could be evaluated in a statistically meaningful way. Therefore, the number of GW501516-induced genes is higher in (A).

