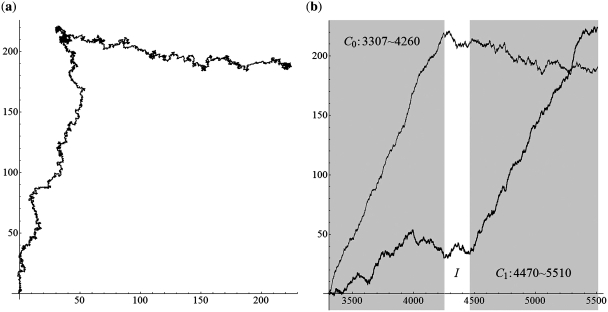
Figure 9.
The TP walk of 3307–5510 H. sapiens (Human) mitochondrial DNA sequence (Δ = 2). (a) Walk trace in the complex plane. (b) Plot of the real part (black) and imaginary part (gray) of the points in the trace against the growing value of position t and the dark areas stand for the coding regions.

