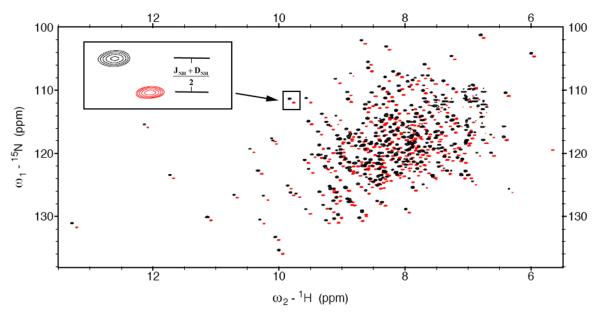
Figure 1.
Superposition of 15N-1H TROSY (red) and HSQC (black) spectrum of substrate-free Arginine Kinase in 10 mg/ml Pf1 phage recoded at 800 MHz. The inset shows half of the one-bond 15N-1H splittings (JNH+DNH)/2 were measured from the difference between 15N frequency in the TROSY and HSQC spectra.

