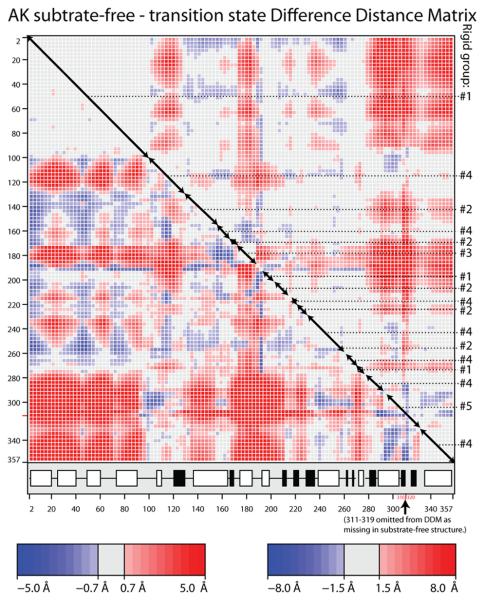
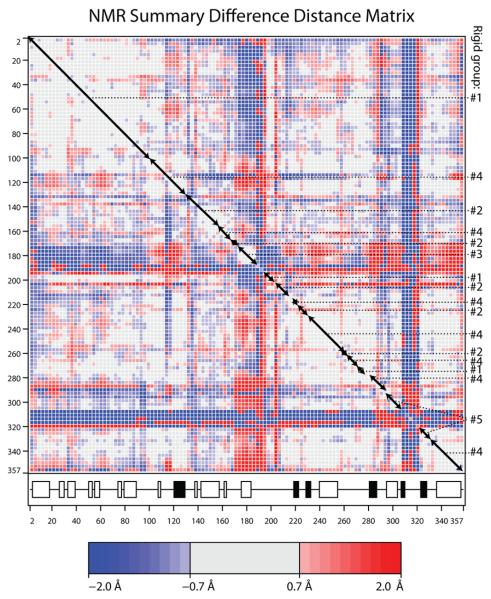
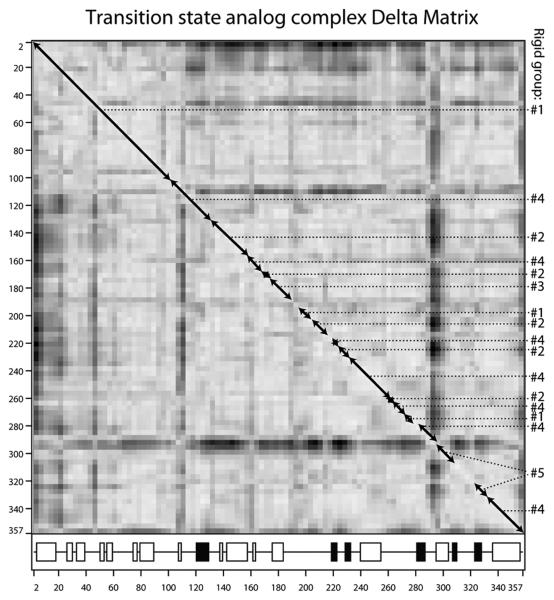
Figure 3.
(A & B) Difference distance matrices for arginine kinase calculated with the program ESCET 41. The intensity of the color is proportional to the change in distance. Error weighting makes little difference, so Å-units are used rather than σ. Residue numbers are shown along the axes. The secondary structure is designated underneath with open boxes for α-helices and filled boxes for β-strands. Red pixels indicate residues that are closer in the transition state form than in the substrate-free form. There are more red regions than blue, because, overall, the enzyme closes upon substrate-binding. Segments of backbone that are moving as quasi-rigid groups will appear as mostly gray boxes along the diagonal. If disparate regions of the sequence have the same rigid transformation, the off-diagonal cross-terms will be close to zero (gray). Assignments to the consensus rigid groups (Error! Reference source not found.) are shown to the right of each panel. (A) Substrate-free minus the transition state analog complex structures (PDB ids 3M10 & 1M15 respectively). The top right half uses a high (1.5 Å) threshold to highlight features that are rigid in crude approximation. The bottom-left half reveals the intra-domain segment structure at lower threshold (0.7 Å). (B) Differences among the ensemble fit to the NMR data for the substrate-free enzyme. Unlike panel A that examined systematic differences between open and closed states, the NMR structures are distributed about an average, so there should be near equal positive (red) and negative (blue) terms. The amplitude of the intrinsic variation (B) is smaller than the amplitude of the substrate-induced change (A), so the DDM is less clear, but the distribution of rigid and flexible regions is similar to that in panel A. (C) Delta matrix calculated from the anisotropic individual B-factors of the 1.2 Å resolution structure of the transition state analog complex 40; 49. Darkness signifies deviation from Hirshfeld's rigid body postulate 48 for the paired groups of atoms. Light regions indicate groups whose displacements are substantially rigid in the cryo-frozen structure: approximately residues 2-107; 112-286 & 300-353. This is in approximate agreement with the high-threshold difference distance matrix (panel A).


