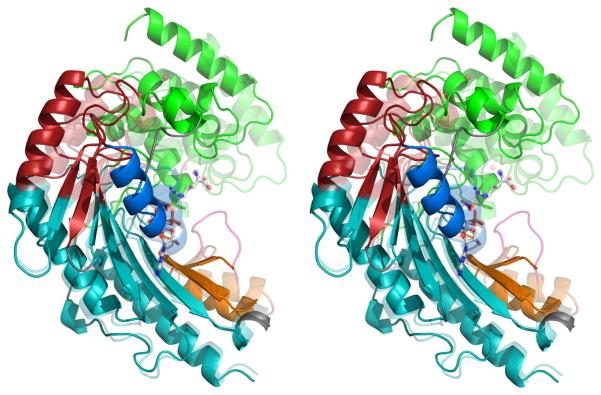
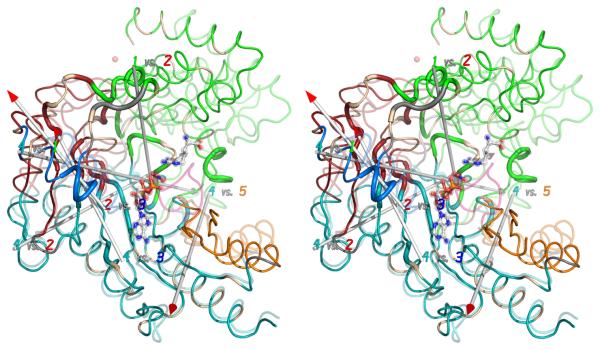
Figure 4.
(A) The crystallographic structures of the open (substrate-free) form (opaque) and closed (transition state) form (transparent) have been superimposed within the largest rigid group (#4). Regions are colored according to the consensus rigid group designation: 1 – green; 2 – red; 3 – blue; 4 – teal; 5 – orange. Flexible regions are colored grey, except for the active site loop (311-319; pink) which is seen only when substrates (ball-&-stick) are bound. (B) Correlation of rigid-group hinge axes with sites of intrinsic dynamics. On top of the substrate-free (opaque) and transition state analog (translucent) structures are overlaid the axes of rotation between the different rigid groups. (With the exception of group 3, all of the transformations are predominantly rotations with small translational components.) Residues exhibiting NMR relaxation exchange, often indicative of local dynamics, were identified earlier 34, and are highlighted here with a wider ribbon. Residues for which no determination was possible (missing or degenerate resonances) are colored light brown.


