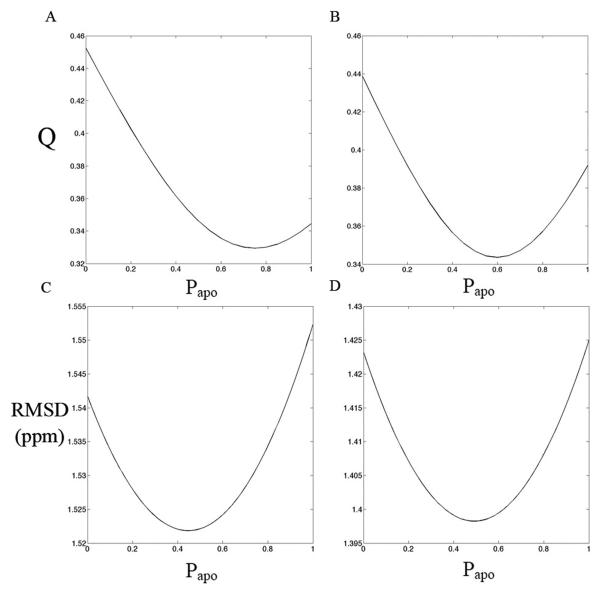
Figure 5.
Q-values between the experimental RDCs from PEG (A) and phage (B) and RDCs calculated by assuming that the open (substrate-free) and closed (TSA) structures are rapidly inter-converting. Q-value vary with the populations of the substrate-free form, Papo, and the transition state, 1-Papo, used to build the model. The lowest Q values are found between the two crystal states. Panels C & D: the RMSD of experimental Cα and Cβ chemical shifts and the chemical shifts predicted from the two state model using Shiftx (C) and Sparta (D).

