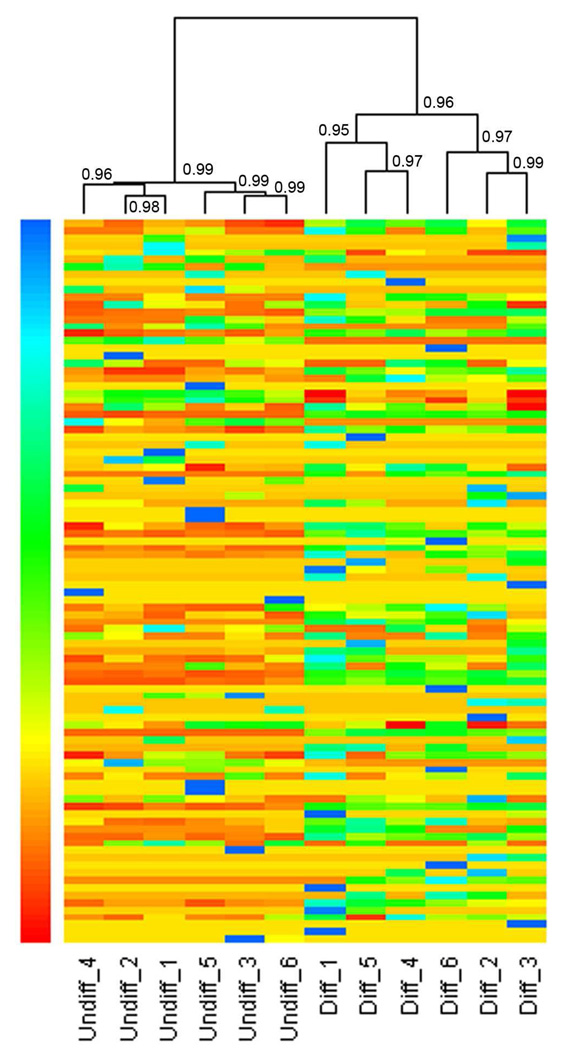
Figure 5. Heat maps with dendrograms of hierarchical clustering for six replicate experiments.
The heat maps were based on the spectral indexes of all high-confidence glycoproteins identified in this work. Each column indicates a replicate experiment, and each row indicates a glycoprotein identified by LC-MS/MS. The number of spectral index increased from red color to blue color. The Pearson correlation coefficients were indicated at each branching point. The heat map was generated with R language. Undiff represents undifferentiated HSR-GBM1 neurospheres, and Diff represents differentiated HSR-GBM1 cells.

