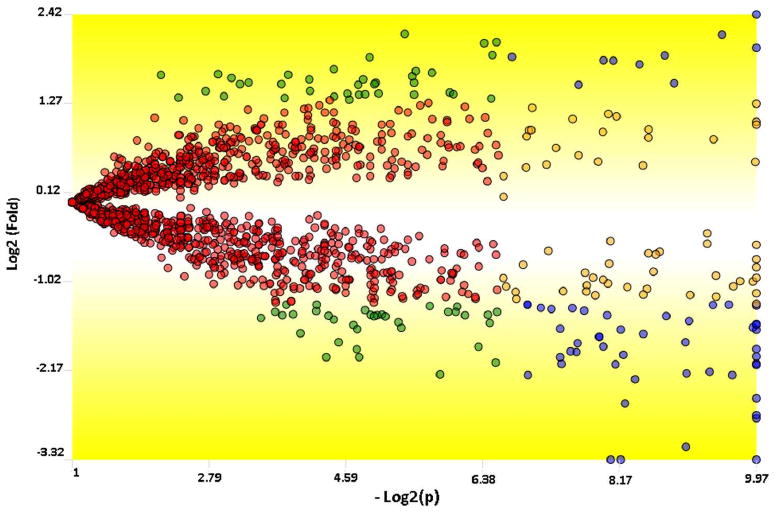
Figure 2.

A TFold comparative plot between the A172r and the A172 cells. Only proteins found in all 6 MudPIT assays were considered for this analysis. Each protein (represented as a dot) is mapped according to its log2 (fold change) on the ordinate axis and its -log2 (t-test p-value) on the abscissa axis. The latter indicates how likely the observed fold change is a result of chance. Fold changes refer to the ratios of the average relative quantitation values obtained for each state. Accordingly, blue-dot proteins have p-value < 0.01 and an absolute fold change greater than 2.5, the established fold-change cutoff. Orange-dot proteins did not meet the fold-change cutoff but were indicated as statistically different. Green-dot proteins met the fold-change cutoff but cannot be claimed to be statistically different. Red dots did not satisfy the fold-change or the statistical cutoffs. The BH theoretical false-positive estimator (q < 0.05) indicates that all proteins selected as differentially expressed are likely to be truly differentially expressed. There are 57, 60, 72, and 1284 blue, orange, green, and red dots, respectively.
