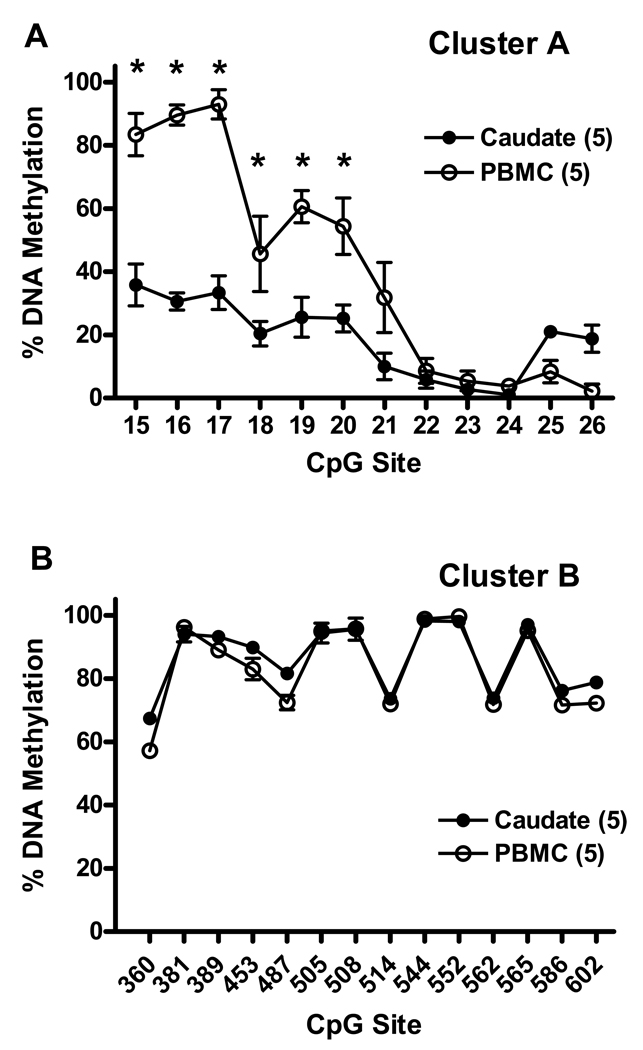
Figure 6.
(A) DNA methylation pattern of cluster A in the caudate and matched PBMCs shown as mean ± SEM of the percent methylation at each CpG site in individual clones shown in Fig 5 (# 10013, 10027, 10043, 10065, and 10094). (B) DNA methylation pattern of cluster B (in exon 4) in the caudate and matched PBMCs of 5 individuals (# 10001, 10002, 10016, 10045, and 10094).

