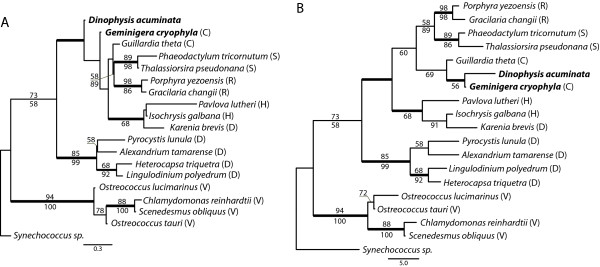
Figure 2.
Protein trees of D. acuminata psbM. Phylogenetic trees of photosystem II subunit M protein. A) Maximum likelihood tree inferred using RAxML. B) Neighbour-joining tree inferred using PAUP*. Bold line indicates ≥ 0.95 Bayesian posterior probability for that branch. Numbers above and below branches represent bootstrap values > 50 from maximum likelihood and distance analyses, respectively. Letters in parentheses to the right of species names represent protist lineages: C, cryptophyte; D, dinoflagellate; H, haptophyte; R, red algae; S, stramenopile; V, Viridiplantae (green algae and land plants).

