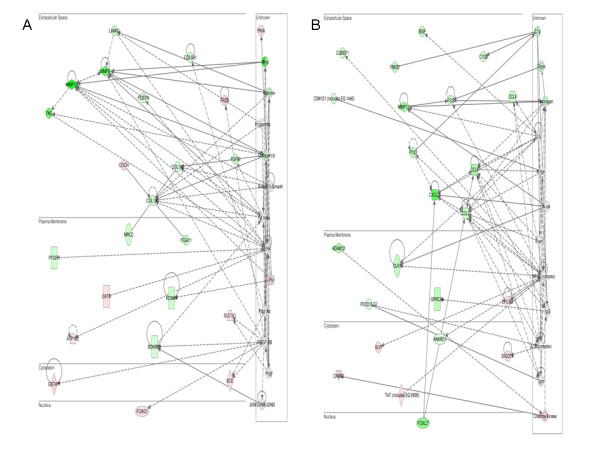
Figure 7.

Top two IPA networks from analysis of all genes differentially expressed in PvS. Comparisons are with respect to polled animals, consequently the more intense green or red indicate greater up- or down-regulation of the respective genes. (A) Connective tissue development and function/skeletal and muscular system development and function/tissue development. (B) Cellular movement/haematological system development/immune cell trafficking.
