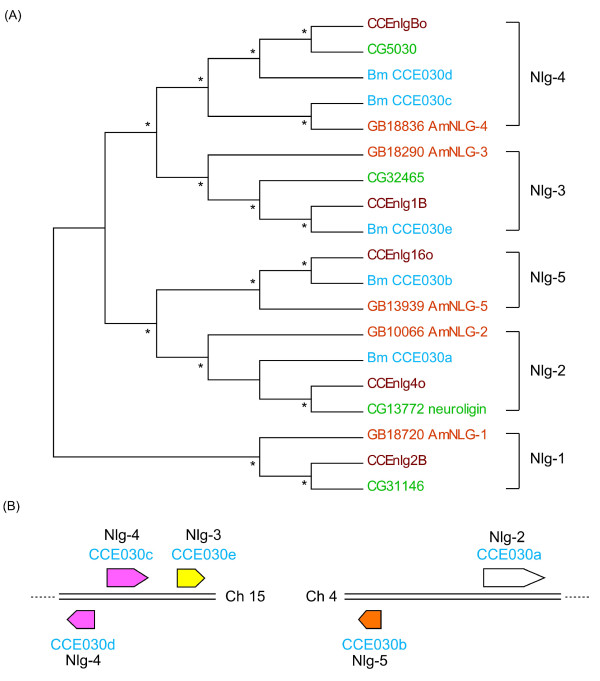
Figure 6.
Phylogenetic and microsynteny analysis of neuroligin genes. (A) The phylogenetic tree of B. mori, D. melanogaster, A. aegypti and A. mellifera neuroligins. Asterisks in the cladogram indicate bootstrap values greater than 50%. For the neuroligins except B. mori, refer to Claudianos et al [2]. Neuroligins of B. mori are colored light blue, D. melanogaster are colored green, A. gambiae are colored brown and A. mellifera are colored orange. (B) The chromosomal locations of B. mori neuroligins. The direction of the arrow indicates the transcription direction. The color of each neuroligin arrow is the same as that for orthologs in Claudianos et al [2].

