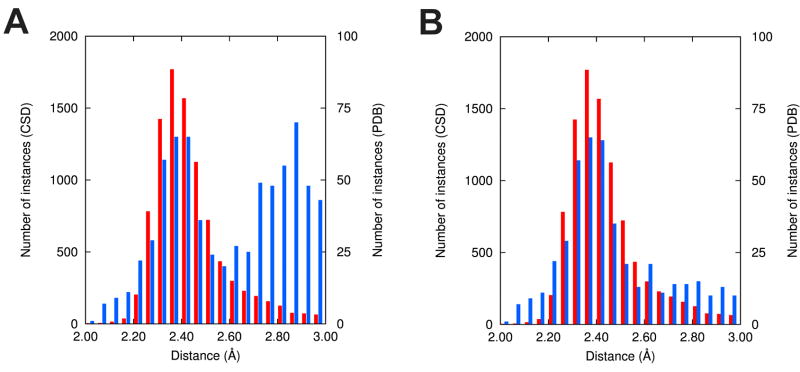
Figure 2.
(A) Distribution of Na+-O distances in the PDB structures determined at resolution 1.2 Å or better (blue bars), and in the Cambridge Structural Database (CSD) (red bars). (B) The same distribution after re-refinement of a single structure (PDB code 3FJ0), which was solved by a traditional (i.e., non-SG) structural biology laboratory.

