
Figure 4.
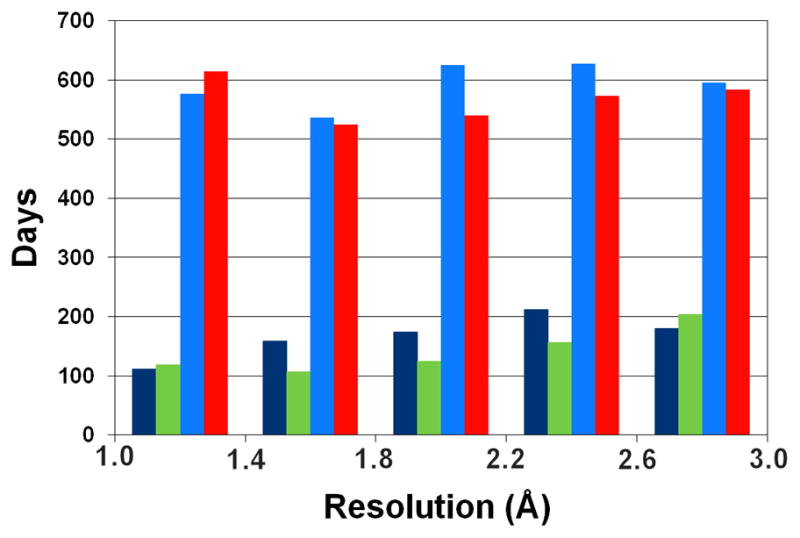
Average time (in days) between data collection and deposition for SG and non-SG structures. Dark blue and green bars represent SG structures, whereas light blue and red bars represent non-SG structures deposited in 2000–2004 and 2005–2009, respectively. Structures were binned by reported resolution limit (0.4 Å bin width).