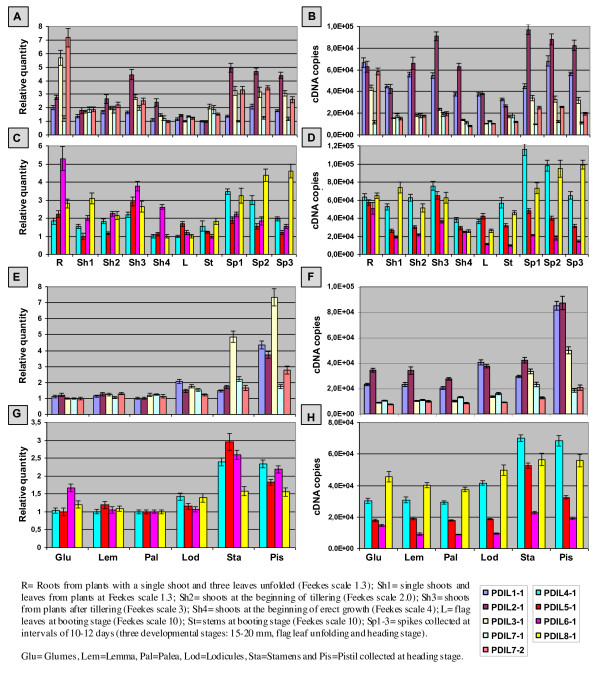
Figure 6.
Expression analysis of PDI and PDI-like genes in different tissues and floral organs. Relative (A, C, E and G) and absolute (B, D, F and H) quantification of the expression level of nine PDI and PDI-like genes in 10 tissues or developmental stages of wheat (A, B, C and D) and in wheat floral organs from fully emerged spikes (E, F, G and H). 20 cDNA pools (two biological replicates, 10 plant samples; A, B, C and D) and 12 cDNA pools (two biological replicates, 6 floral organ samples; E, F, G and H) were tested in triplicate and normalized using the geometric average of the relative expression of the two reference genes encoding Cell division control protein and ADP-ribosylation factor. The relative expression levels of the nine genes were referred to that of a calibrator set to the value one, which was represented by the tissue (A and C) or floral organ (E and G) with the lowest expression. The absolute expression levels of the nine genes were expressed as number of cDNA copies per μg of reverse transcribed total RNA (B, D, F and H). Normalized values of relative and absolute expressions of the nine genes are given as average ± SD.

