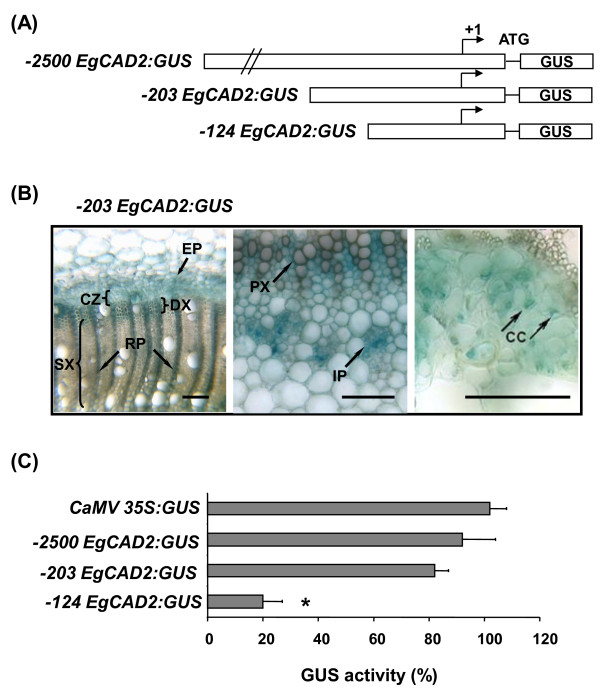
Figure 1.
Delineation of the regulatory region in the EgCAD2 promoter. (A) Schematic maps of the 5'-deleted EgCAD2 promoter-GUS fusions. (+ 1), transcription start site; GUS, uidA coding region. (B) Histochemical analysis of GUS expression driven by the -203 EgCAD2 promoter in stem cross sections of transgenic tobacco plants. From left to right, general view of the secondary xylem zone, enlargement of primary xylem zone, enlargement of internal phloem. Bars represent 100 μm. CC, companion cells; CZ, cambial zone; DX, differentiating xylem; EP, external phloem; IP, internal ploem; PX, primary xylem; RP, xylem ray parenchyma; SX, secondary xylem. These images are representative of 12-17 greenhouse-grown, 8-week-old independent transformants. (C) Fluorimetric assays of GUS activity in transgenic tobacco BY2 cell calli. Histograms represent mean values and standard deviations of three measurements, each on 45 independent calli, expressed as % of the CaMV 35S promoter activity. Activity driven by EgCAD2 5'deletion promoter construct statistically different relative to the control (-2500 EgCAD2) is highlighted with an asterisk, (Student's P = 0.02).

