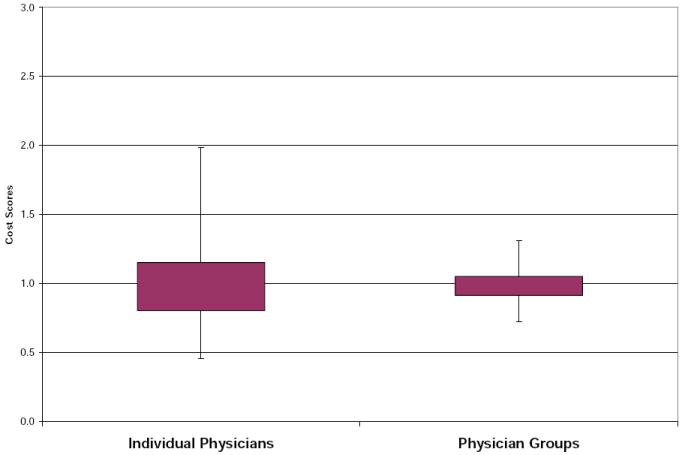
Exhibit 1.

Distribution of Provider Cost Profiles*
Providers with cost scores above 1 have higher costs than expected while providers with cost profiles less than 1 have lower costs than expected. Box represent 25th and 75th percentile, tails represent 5th and 95th percentiles
