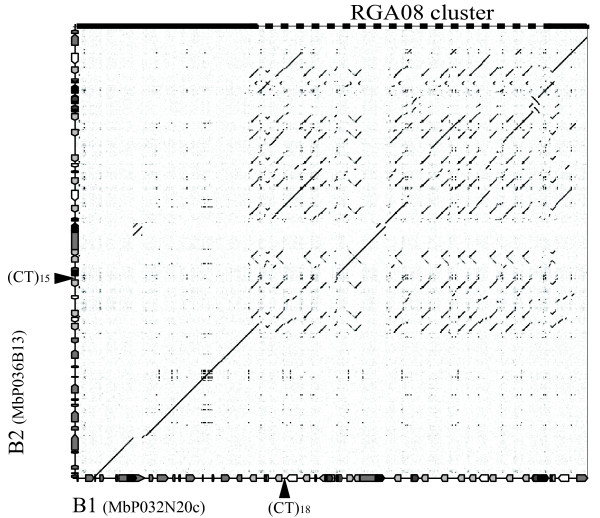
Figure 1.
Dotplot analysis of the RGA08 loci in M. balbisiana. The dotplot alignment between the B1 and B2 sequences reveals patterns of sequence colinearity and divergence. The X axis corresponds to the MbP026I06-MbP032N20 contig of 253 kb and the Y axis corresponds to 223 kb of BAC MbP036B13. Genes are represented as arrow boxes with the head indicating transcription direction, light grey arrow boxes represent RGAs and black boxes represent transposable elements. Localization of the CT repeat mMaCIR341 microsatellite with the corresponding number of repeats is indicated by arrows. Colinear patterns at the beginning and the end of the contig (highlighted on the top of the figure with a plain line) and complex repetitive pattern (dash line) corresponding to the RGA cluster are indicated.

