
Figure 2.
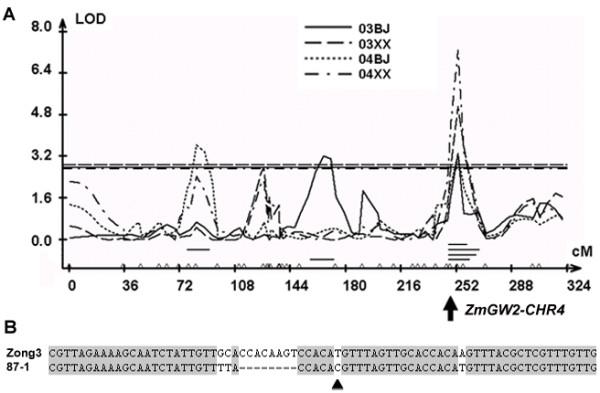
QTL analysis in the IF2 population. A. QTL profile for HKW generated from QTL Cartographer. 03, year 2003; 04, year 2004; BJ, Beijing; XX, Xunxian. B. Polymorphisms between the two parental lines Zong3 and 87-1 used to develop the IF2 population in the promoter region of ZmGW2-CHR4. The triangle represents site S40 (see details in Table 5).