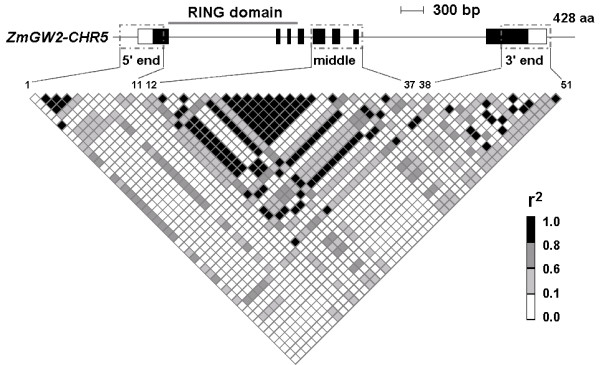
Figure 4.

Pattern of pairwise LD in ZmGW2-CHR5. All polymorphisms with minor allelic frequency exceeding 0.05 were used. In the gene diagram, filled black boxes represent exons, and open boxes indicate the UTRs. Grey dash-dot boxes mark the regions sequenced in this study. Polymorphisms 1 to 11 are from the 5' end, 12 to 37 from the middle region, and 38 to 51 from the 3' end. The polymorphisms and their locations on the gene diagram are connected by lines.
