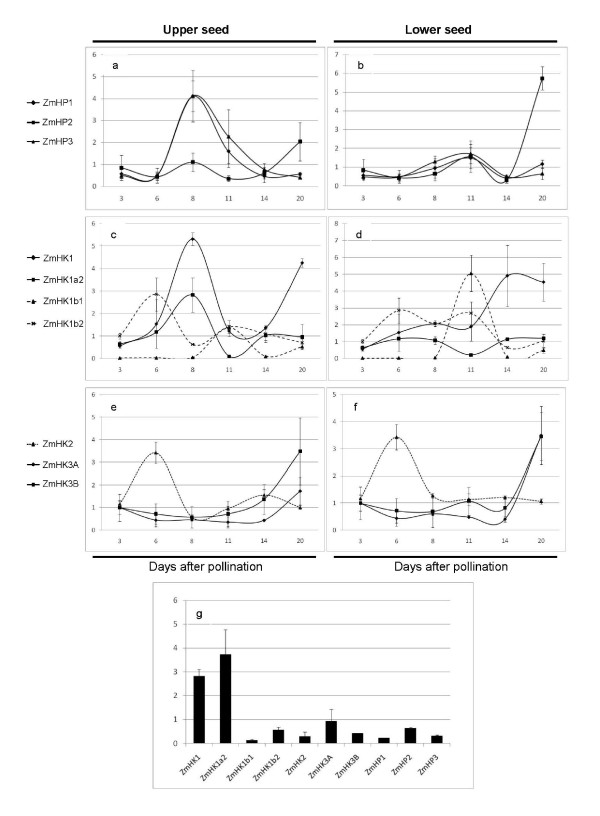
Figure 3.
Expression of TCS components along early seed development. Results are the average and standard deviation of three replicates. Numbers in the X-axis indicate days after pollination. All values are relative to the expression of the housekeeping gene ZmFKBP66. Results are shown as lines and divided into upper (left panels) and lower (right panels) seed halves, except at 3 and 6 DAP, for which the sample represents the whole kernel. The expression in the embryo for each transcript at 20 DAP is represented as a single time point in a bar graphic (g).

