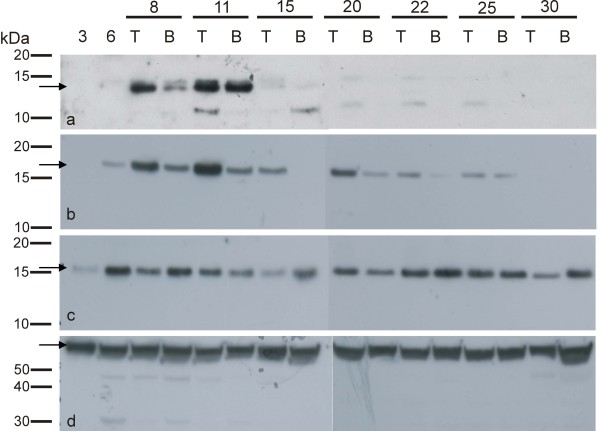
Figure 4.
Characterization of protein profiles along development. Detection of native peptides in soluble extracts of 3 to 30 DAP kernels. T and B indicate upper (Top) and lower (Bottom) half of the kernel, respectively. a ZmTCRR-2; b ZmHP1 and 3; c ZmHP2; d ZmFKBP66, used as a loading control. The polypeptide with the predicted size is marked by an arrow in each case.

