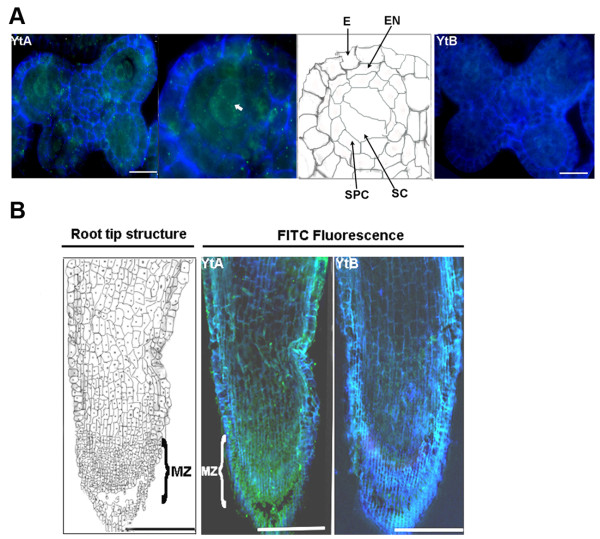
Figure 2.
Expression pattern of ORFH79 in anther and root tip of YtA. Positive signals are green (FITC), while autofluorescence is pseudo-colored blue. A Expression pattern of ORFH79 in a premeiotic anther. The signal has accumulated in the sporogenous cells (white arrow) of the premeiotic YtA anther. In the premeiotic YtB anther, no ORFH79 signal was present (bar represents 20 μm). B Expression pattern of ORFH79 in root tip. In the 5-day-old YtA root tip, signals were found to mainly accumulate in the meristematic region (MZ); In the five day old YtB root tip, the signal was barely detectable (bar represents 100 μm). E, epidermis; En, endothecium; SPC: Secondary parietal cell; Sc, sporogenous cell; MZ, meristematic region.

