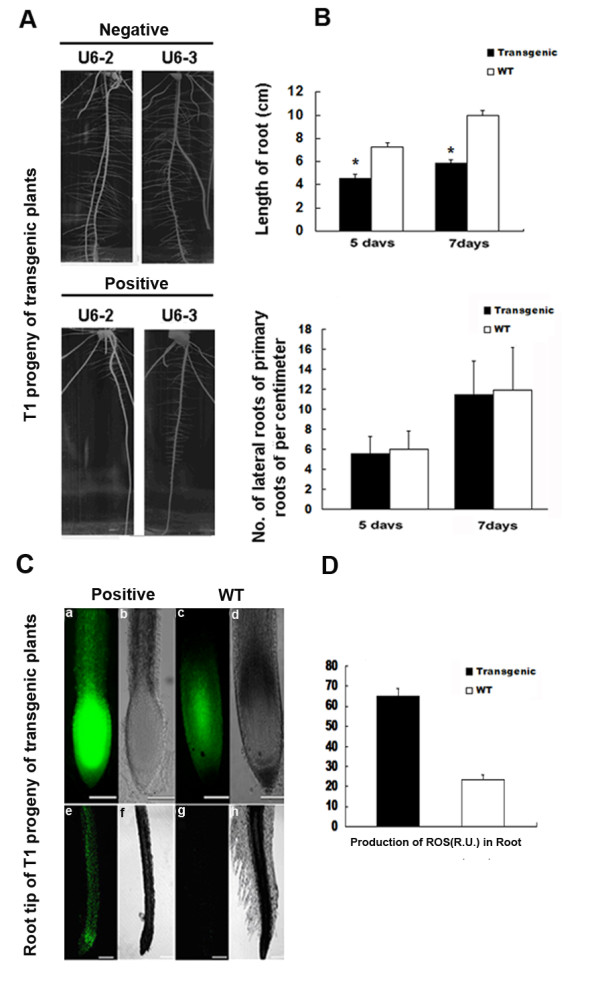
Figure 6.

Root morphology and intracellular production of reactive oxygen species (ROS) analysis in root tip of transgenic rice lines carrying orfH79. A Two independent T1 progeny transgenic seedlings (U6-2, U6-3) which are eight days after germination on 1/2 MS in vertical plates. B Length of the primary roots of 5-day- old and 7-day-old seedlings, and the number of lateral roots of five and seven day old seedlings were recorded and analyzed. The data represent the mean value ± SE from 8 (positive and negative) plants. *, indicates that difference between transgenic and wild type plants is significant (p < 0.05). Positive: transgenic plant carrying orfH79; negative: non-transgenic plant. C Seedlings were grown on 1/2 MS in vertical plates for five days. Root tips were incubated in 10 μM H2DCFDA for 10 min, and an image of ROS production was captured using confocal microscopy. a b e and f , Confocal images of T1 transformants carrying orfH79. c d g and h , Confocal images of non-transgenic plants. a , c , e , g , Fluorescent field. b , d , f , h , Bright field (bar represents 500 μm). D Production of ROS in roots of transgenic and wild type. plants. ROS content in root was quantified after compiling the projections from 32 confocal sections of 0.75 μm each. R.U, relative unit. The data are given as mean ± SE (n = 3).
