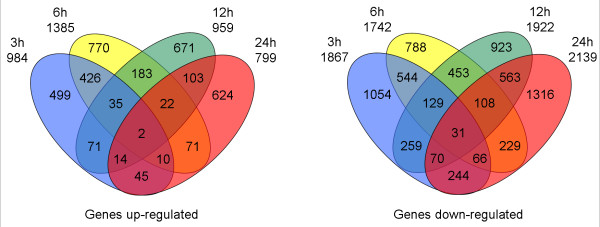
Figure 3.
Venn diagram, depicting the overlap of regulated genes at various time points. The number outside the circle denotes the total number of genes up- (on the left) or down- (on the right) regulated at specific time point. The number within one circle or more than two circles denotes the time specific genes or overlapped genes, respectively.

